

помогите пожалуйста сделать задание...
Вычисление значений тригонометрических функций на основе разложения в ряд Маклорена
1. Вычислить с заданной точностью значения тригонометрических функций arctg(x);
2. Построить графики функций arctg(x), где x - ограниченно;
3. Оценить погрешности вычислений;
![]() Правила форума :: Скачать Pascal :: FAQ // Ада–2020 :: Скачать GNAT :: OEM–2015 :: Ada -> C/C++
Правила форума :: Скачать Pascal :: FAQ // Ада–2020 :: Скачать GNAT :: OEM–2015 :: Ada -> C/C++
 ВНИМАНИЕ!
Прежде чем задать вопрос, смотрите FAQ.
Рекомендуем загрузить DRKB.
Наладить общение поможет, если вы подпишитесь по почте на новые темы в этом форуме.
| Mad Dam |

Сообщение
#1
|
|
Новичок  Группа: Пользователи Сообщений: 18 Пол: Мужской Реальное имя: Бадык Репутация:  0 0  |
|
   |

 
|
  |
Ответов
| volvo |
Сообщение
#2
|
|
Гость |
Вот программа:
unit Unit1;, на Chart-е одна Серия, типа TLineSeries... После нажатия на кнопку получаешь в Чарте график арктангенса, а в Edit-е - среднюю погрешность вычисления. Вот так это выглядит: 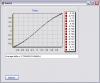 |
|
|
|
Сообщений в этой теме
 Mad Dam Вычисление значений тригонометрических функций на основе разложения в ряд Маклорена 3.01.2009 18:28
 volvo Mad Dam, само разложение функции в ряд Маклорена з… 3.01.2009 18:40 Mad Dam вот я нашел в интернете...
arctg x=x-x^3/3+x^5/5-x… 3.01.2009 19:56 volvo Вот и прекрасно... Теперь пишешь функцию, вычисляю… 3.01.2009 22:36 Mad Dam скажи пожалуйста...с использованием какой именно ф… 3.01.2009 23:10 volvo Я тебе выше написал код. Так _arctan, это по-твоем… 3.01.2009 23:16 Mad Dam спасибо огромное...сейчас попробую.. 3.01.2009 23:21 Mad Dam привет..а тот код написан на delphi или pascal? из… 4.01.2009 17:31 volvo Это Дельфийский код, раз там присутствует Result..… 4.01.2009 17:59 Mad Dam ну вот я вставляю код, который ты мне прислал посл… 4.01.2009 18:06 volvo ... и что ты хочешь, чтоб случилось? Я тебе привел… 4.01.2009 18:11 Mad Dam спасибо..
блин...я даже не знаю как ее вызвать и з… 4.01.2009 18:33 dron4ik Попробуй по другому по решать) 5.01.2009 18:39 Mad Dam спасибо большое...я честно очень тебе благодарен..… 10.01.2009 19:49 Mad Dam вот смотри код немного переделал...
unit Unit1;
… 10.01.2009 23:17 Mad Dam volvo, помоги пожалуйста...исправить и сделать что… 11.01.2009 1:45 volvo Ты сначала расскажи, что такое "Проверка вычи… 11.01.2009 2:00 Mad Dam ну правильность решения _arctan(x) проверяю с пом… 11.01.2009 15:12 dron4ik Помогите написать функцию которая осуществляет это… 11.01.2009 17:40 Mad Dam volvo....спасибо все прекрасно работает) но только… 12.01.2009 1:13 Mad Dam а ответ нужно выводить непосредственно после функц… 12.01.2009 16:30 volvo Да блин, объясни ты мне, КАКОЙ тебе еще ответ-то н… 12.01.2009 17:01
volvo Mad Dam, само разложение функции в ряд Маклорена з… 3.01.2009 18:40 Mad Dam вот я нашел в интернете...
arctg x=x-x^3/3+x^5/5-x… 3.01.2009 19:56 volvo Вот и прекрасно... Теперь пишешь функцию, вычисляю… 3.01.2009 22:36 Mad Dam скажи пожалуйста...с использованием какой именно ф… 3.01.2009 23:10 volvo Я тебе выше написал код. Так _arctan, это по-твоем… 3.01.2009 23:16 Mad Dam спасибо огромное...сейчас попробую.. 3.01.2009 23:21 Mad Dam привет..а тот код написан на delphi или pascal? из… 4.01.2009 17:31 volvo Это Дельфийский код, раз там присутствует Result..… 4.01.2009 17:59 Mad Dam ну вот я вставляю код, который ты мне прислал посл… 4.01.2009 18:06 volvo ... и что ты хочешь, чтоб случилось? Я тебе привел… 4.01.2009 18:11 Mad Dam спасибо..
блин...я даже не знаю как ее вызвать и з… 4.01.2009 18:33 dron4ik Попробуй по другому по решать) 5.01.2009 18:39 Mad Dam спасибо большое...я честно очень тебе благодарен..… 10.01.2009 19:49 Mad Dam вот смотри код немного переделал...
unit Unit1;
… 10.01.2009 23:17 Mad Dam volvo, помоги пожалуйста...исправить и сделать что… 11.01.2009 1:45 volvo Ты сначала расскажи, что такое "Проверка вычи… 11.01.2009 2:00 Mad Dam ну правильность решения _arctan(x) проверяю с пом… 11.01.2009 15:12 dron4ik Помогите написать функцию которая осуществляет это… 11.01.2009 17:40 Mad Dam volvo....спасибо все прекрасно работает) но только… 12.01.2009 1:13 Mad Dam а ответ нужно выводить непосредственно после функц… 12.01.2009 16:30 volvo Да блин, объясни ты мне, КАКОЙ тебе еще ответ-то н… 12.01.2009 17:01 Mad Dam спасибо большое...сейчас переделаю.. 12.01.2009 17:04
 |
1 чел. читают эту тему (гостей: 1, скрытых пользователей: 0)
Пользователей: 0

|
Текстовая версия | 7.05.2024 23:03 |
Связь с администрацией: bu_gen в домене octagram.name